Seismo Blog
All Punches Went Towards Napa
Categories: Bay Area | West Napa Fault | Earthquake Faults and Faulting
August 26, 2014
Two days after the early morning magnitude 6.0 earthquake shook the Wine Country and beyond, it has become clear that the City of Napa bore the brunt of the damage. More than 70 buildings in the heart of the town were red tagged, declaring them too damaged for further occupancy. In addition, more than four fifths of the 250 people injured during the quake lived in and around Napa.
There are many factors which determine the extent and location of damage during a temblor. First and foremost on the list is the type and the condition of a building. Structures built from unreinforced masonry or adobe blocks are much more prone to damage than sturdy wooden buildings or highrises constructed with well reinforced concrete on rubber isolators. Unfortunately many buildings in downtown Napa - although well maintained - were of the older masonry type. A second factor is the soil below a structure. In general buildings founded on bedrock fare much better in an earthquake than houses built on unconsolidated sediments. Again, much of Napa is built on the loose sediments of the Napa River. While they provide a wonderful terroir for vinticulture, they are a less than perfect building ground.
Thirdly, the earthquake itself can determine the zones of most severe damage. On the one hand the destructive shear waves are not radiated from the hypocenter in an omnidirectional pattern. Instead they are emitted in the shape of a cloverleaf with the strongest lobes along and perpendicular to the fault. Napa lies exactly in the axis - or "along the strike" as seismologists call it - of the West Napa Fault, the assumed origin of Sunday's quake. But there is also another factor during the earthquake which can determine the zones of damage, that is the direction of the rupture itself.
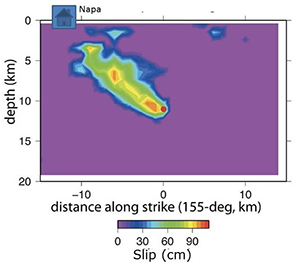
Using the detailed recordings of eight high quality seismometer stations, Doug Dreger from the Berkeley Seismological Laboratory put together a model for the fault rupture of Sunday's quake. His color coded "fault model" (see figure) is a two-dimensional view of the fault plane. The color purple means no movement during the rupture at all, blue means some rupture and the redder the color gets, the more the two flanks of the fault slip past each other (see scale at bottom of the figure).
The red dot in the middle is the actual hypocenter at a depth of about 7 miles. From there the rupture moved left, in this case north-north-west, and up with three distinct zones where the slip exceeded more than three feet. These zones are represented by the yellow-brown areas in the plot. In total the rupture extends for approximately 7.5 miles from the epicenter on a trajectory that points directly towards the town of Napa. The effect of this directionality is comparable to the punch of a boxer: If the movement of his fist is targeted directly towards you, his punch hurts much more than if the blow would hit you only at a glancing angle or missed you completely. (hra094)
BSL Blogging Team: Who we are
Recent Posts
-
: Alerts for the Whole West Coast
-
: Destruction in the Eastern Aegean Sea
-
: An Explosion in Beirut heard all over the Middle East
View Posts By Location
Categories
- Alaska (3)
- Bay Area (24)
- Buildings (3)
- Calaveras (4)
- California (13)
- Central California (4)
- Chile (4)
- Earthquake Early Warning (10)
- Earthquake Faults and Faulting (44)
- Earthquake Science (3)
- Haiti (3)
- Hayward (12)
- Indonesia (4)
- Induced Seismicity (3)
- Instrumentation (18)
- Italy (6)
- Japan (7)
- MOBB (3)
- Mendocino Triple Junction (5)
- Mexico (7)
- Nepal (3)
- North Korea (5)
- Nuclear Test (5)
- Ocean Bottom Seismometer (3)
- Oklahoma (4)
- Plate Tectonics (18)
- Preparedness, Risks, and Hazards (15)
- Salton Sea (3)
- San Andreas Fault (14)
- Seismic Waves (13)
- Seismograms (4)
- ShakeAlert (3)
- Southern California (5)
- Surface Waves (3)
- Today in Earthquake History (20)
- Volcanoes (4)
- subduction (3)
