Seismo Blog
A Race Across the Pacific Ocean
Categories: Instrumentation | Seismograms | Seismic Waves | Surface Waves
July 19, 2010
It was the middle of Sunday night in the South Pacific nation of Papua New Guinea. One of its islands, New Britain, is known for its striking natural beauty, its active volcanoes and its powerful earthquakes. But only rarely is the island hit by two strong earthquakes within 30 minutes of each other, as happened on Sunday. So far, no major damage has been reported, even though the two quakes had magnitudes of 6.9 and 7.3, respectively. Their foci were both more than 40 miles beneath the surface, in an area where the Solomon Sea Plate is subducted under the Bismarck Plate. For each of these quakes, the first waves traveled halfway around the world within 20 minutes, but the vibrations of the first masked many of the arrivals from the second. That made it rather difficult for seismologists to determine the exact location and magnitude of the second earthquake.
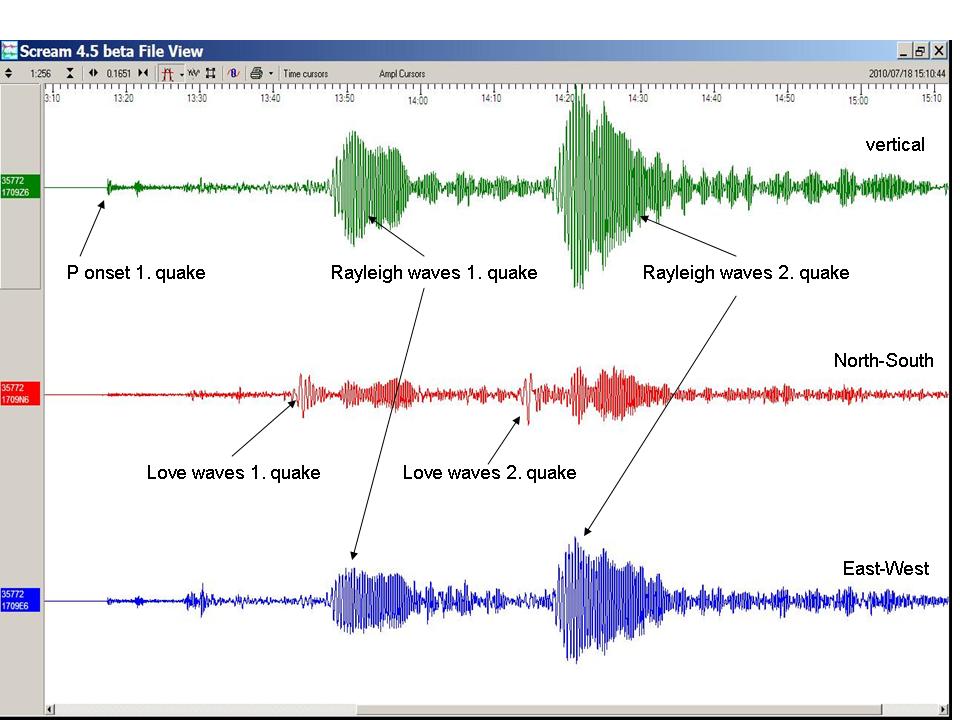
A seismogram of Sunday's quake, recorded at an earthquake station in California. (Click to view larger image.)
But here in California, the seismograms of the double earthquake whammy had their own kind of beauty - at least in the eyes of us narrow-minded seismologists. Here is why: A year ago, the blogger described the two types of surface waves generated by strong earthquakes (see blog July 27, 2009). In addition to having different names - one type is called Love waves and the others are Rayleigh waves - the two kinds of wave travel with substantially different speeds, and each of them makes the ground vibrate in its own characteristic way. The Love waves shake the ground only horizontally, perpendicular to the direction of wave propagation. Rayleigh waves make the ground particles move elliptically in a plane that lies parallel to the arrow of propagation.
In most seismograms, the two types of surface waves are mixed and cannot be easily distinguished from one another. But because New Britain lies almost directly west of California when measured on a great circle, the difference in speed and particle motion of these two types of waves clearly showed on Sunday's seismograms, like the one shown here from an earthquake station in the Sierra foothills of Fresno County. It shows the ground motion in three orthogonal directions: The green trace displays the movement up and down, the red trace shows the North-South movement in the horizontal plane and the blue trace gives the East-West movement.
As the waves moved through our state from west to east, the Love waves only showed on the red traces, representing the North-South movement of the ground, which in this case is perpendicular to the direction of wave propagation. In contrast, the Rayleigh waves showed most strongly on the vertical and East-West traces, because of their elliptical motion. This pattern repeats for the waves of the second quake.
In both cases, the Love waves arrived first, as they travel with greater velocity. They traversed our Golden State with a speed of almost 11,000 miles per hour. The Rayleigh waves lagged behind, because it took them almost 44 minutes to race across the Pacific Ocean at a speed of "only" 9000 miles per hour. (hra060)
BSL Blogging Team: Who we are
Recent Posts
-
: Alerts for the Whole West Coast
-
: Destruction in the Eastern Aegean Sea
-
: An Explosion in Beirut heard all over the Middle East
View Posts By Location
Categories
- Alaska (3)
- Bay Area (24)
- Buildings (3)
- Calaveras (4)
- California (13)
- Central California (4)
- Chile (4)
- Earthquake Early Warning (10)
- Earthquake Faults and Faulting (44)
- Earthquake Science (3)
- Haiti (3)
- Hayward (12)
- Indonesia (4)
- Induced Seismicity (3)
- Instrumentation (18)
- Italy (6)
- Japan (7)
- MOBB (3)
- Mendocino Triple Junction (5)
- Mexico (7)
- Nepal (3)
- North Korea (5)
- Nuclear Test (5)
- Ocean Bottom Seismometer (3)
- Oklahoma (4)
- Plate Tectonics (18)
- Preparedness, Risks, and Hazards (15)
- Salton Sea (3)
- San Andreas Fault (14)
- Seismic Waves (13)
- Seismograms (4)
- ShakeAlert (3)
- Southern California (5)
- Surface Waves (3)
- Today in Earthquake History (20)
- Volcanoes (4)
- subduction (3)