Monitoring of Relative Velocity Change Following the 2014 Mw 6.0 South Napa Earthquake (Archived)
Last updated on 09-16-14. The revised website can be found at SNapa_Noise.
We analyze ambient seismic noise wavefield to monitor temporal variations in seismic velocity associated with the 24 August 2014 Mw 6.0 South Napa earthquake.
Temporal Evolution in Seismic Velocity
We estimate relative velocity changes (dv/v) with MSNoise [Lecocq et al., 2014]. We use continuous waveforms collected at eight seismic stations that locate near the epicenter of the 2014 South Napa earthquake. Following Brenguier et al. [2008], our preliminary analysis focuses on the vertical component waveforms in a frequency range of 0.1-0.9 Hz.
We estimate the reference Green’s function (GF) for each station pair as the average of 1-day GFs obtained in the time interval, January through July 2014. The time history of dv/v is determined by measuring delay times between 30-day stacks of GFs and the reference GF.
We obtain about 0.05% velocity reduction following the South Napa earthquake (Figure 1). Note that dv/v is plotted at the end of the 30-day-length time window that is used for computing 30-day stacks of GFs. Note also that the temporal variability of dv/v in the time interval 2014.160-2014.235 is likely due to the reduced number of station pairs. Three stations (NC.NAPC, NC.NSP, and NC.NMI) were temporally down in this time interval. We therefore examine the dv/v without these three stations. Although the uncertainty of the dv/v measurement is increased, we observe the change in dv/v following the South Napa earthquake (Figure 2).
To monitor the relative velocity change, we implement an automated system that updates the time history of dv/v shown in Figure 1. This automated process makes use of waveforms archived at the Northern California Earthquake Data Center [NCEDC, 2014]. Figure 1 is currently updated every day.
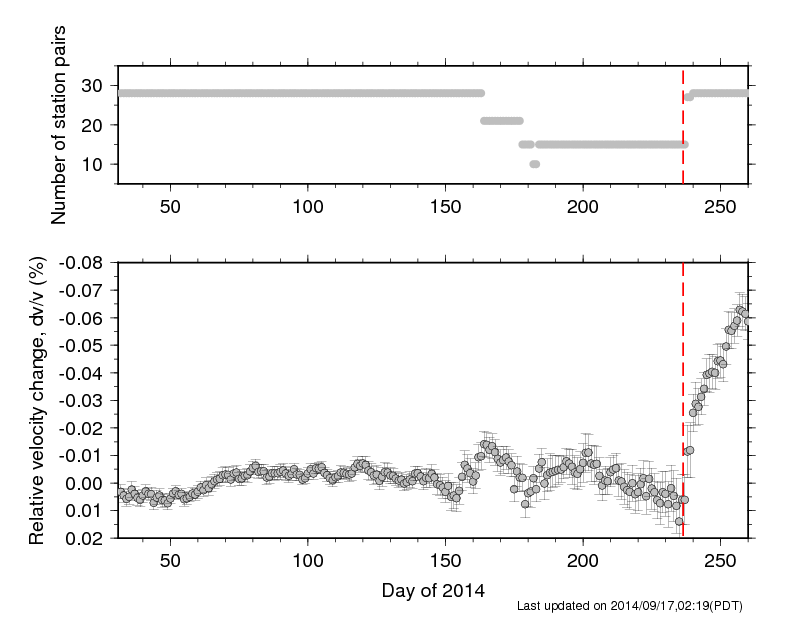
Figure 1. Top panel shows the number of stations pairs used to infer the relative velocity change (dv/v). The bottom panel shows the time history of dv/v. The error bars represent the two-sigma standard deviation. The dashed red line indicates the origin time of the South Napa earthquake.
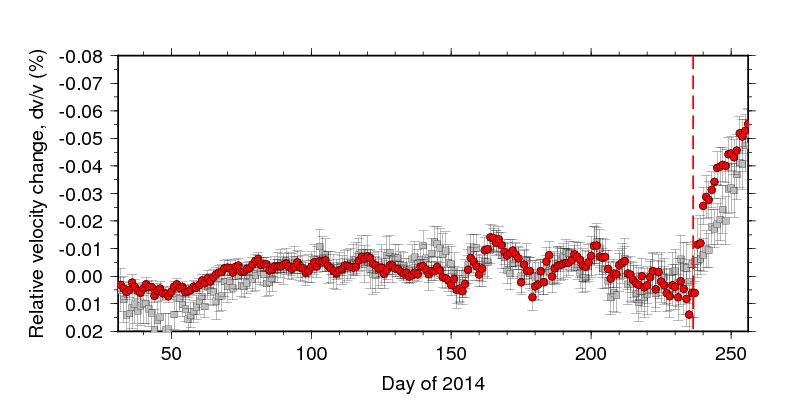
Figure 2. Comparison of dv/v measurements between the two different sets of stations. Red circles are dv/v inferred with all 8 stations. Gray squares are dv/v obtained with 5 stations in which we exclude data from the 3 stations that were temporally down during 2014.160-2014.235.
Map View
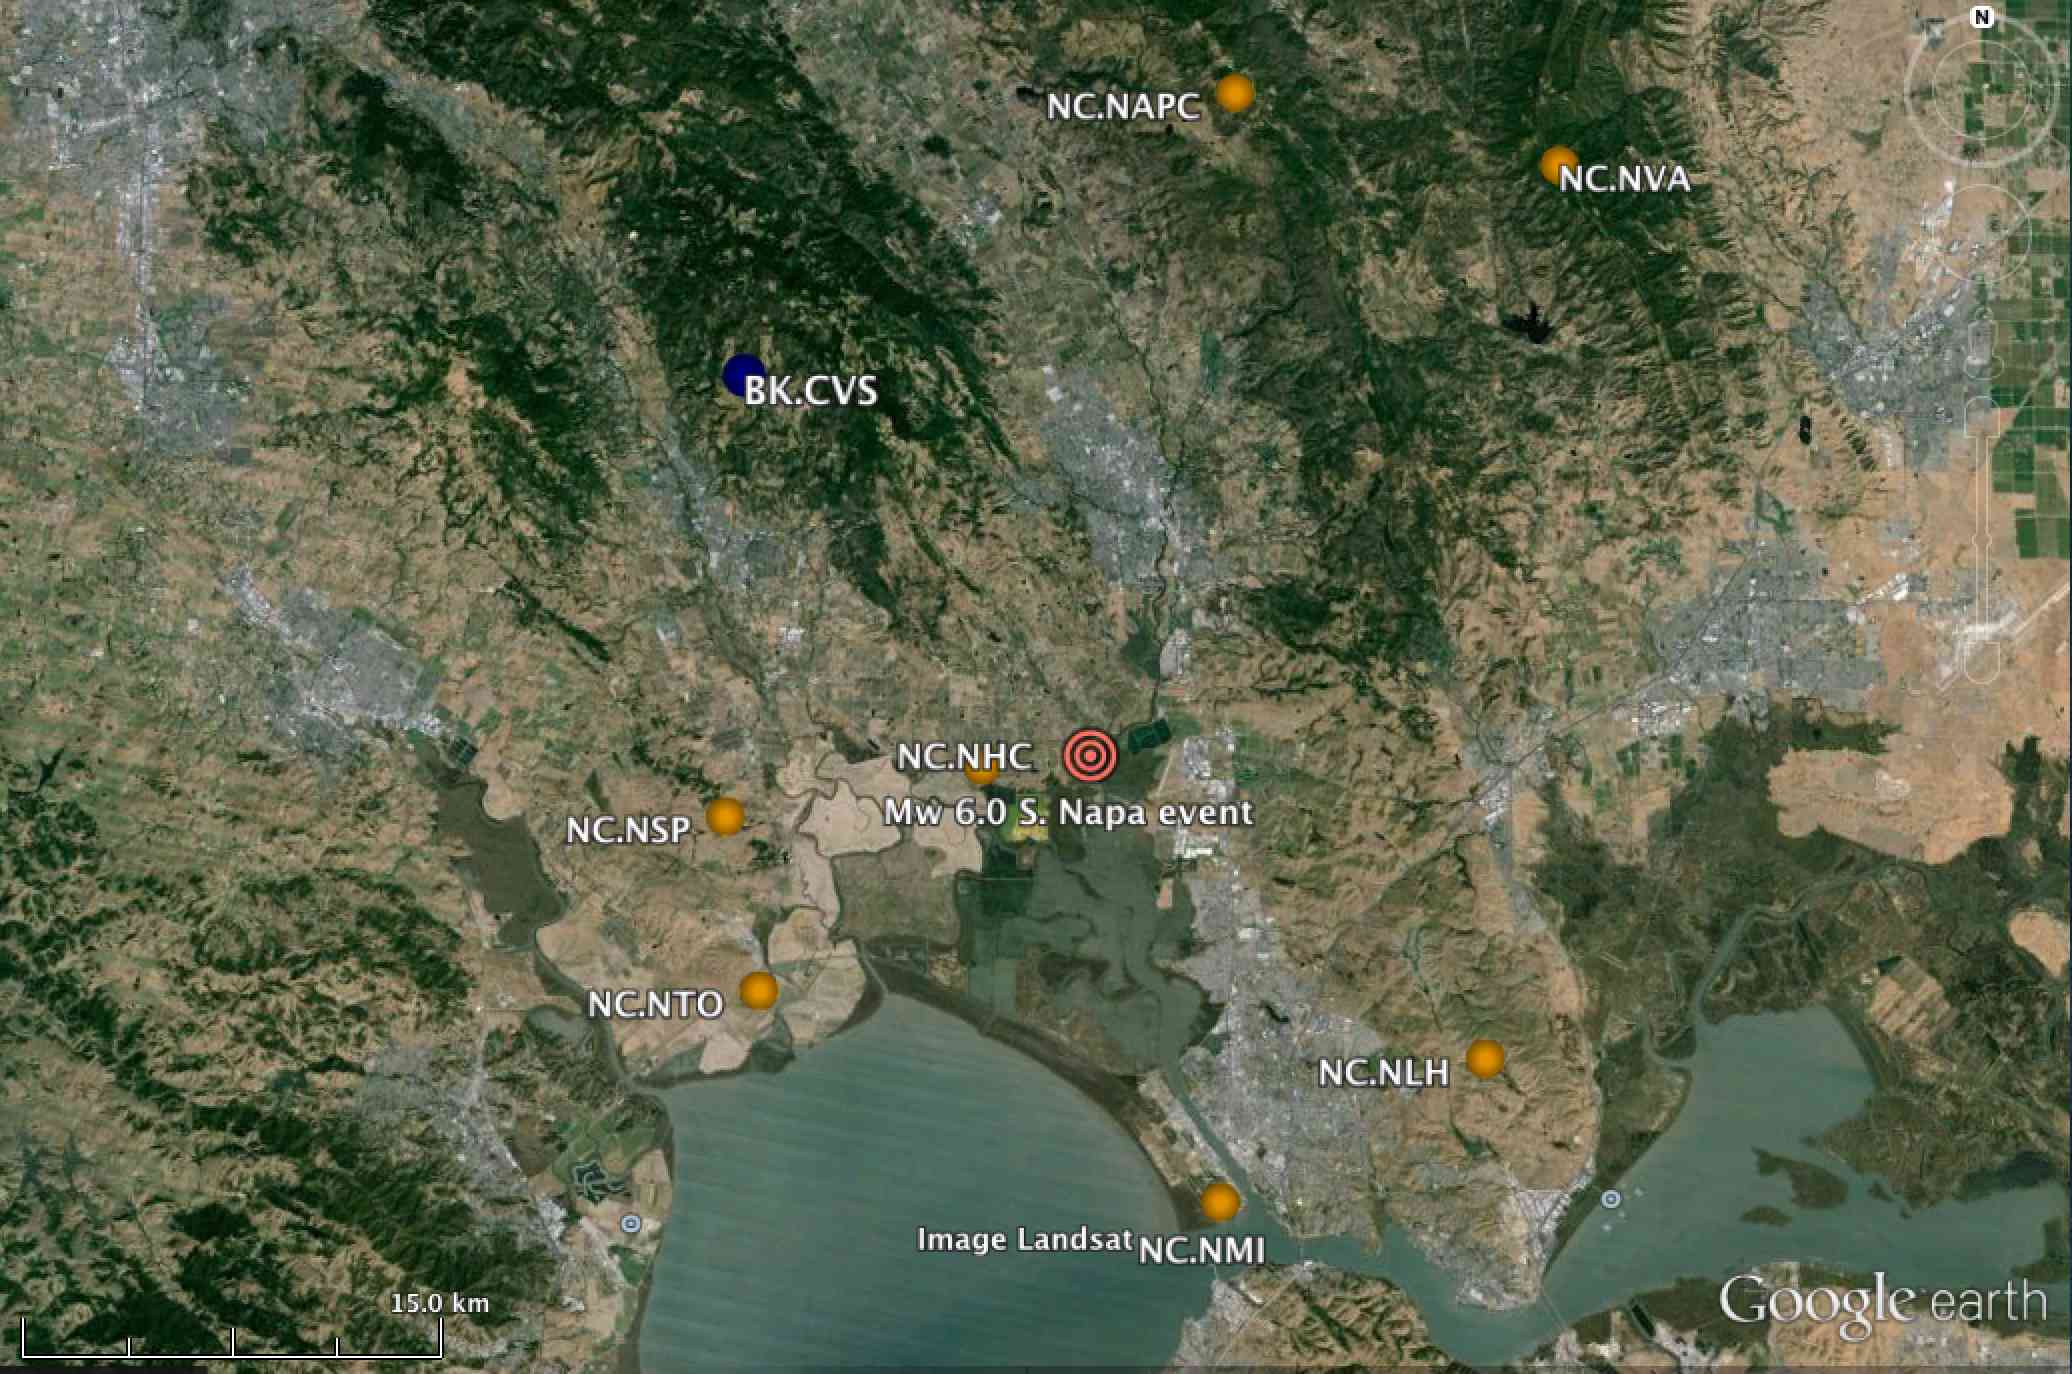
Figure 3. Map view of stations and the South Napa earthquake.
Acknowledgments
This work is partially support by the France-Berkeley Fund 2014-0051 and the National Science Foundation EAR-1053211. Waveform data, metadata, and earthquake catalog for this study were accessed through the Northern California Earthquake Data Center (NCEDC) [NCEDC, 2014].
References
Brenguier, F., M. Campillo, C. Hadziioannou, N. M. Shapiro, R. M. Nadeau, and E. Larose (2008), Postseismic relaxation along the San Andreas Fault at Parkfield from continuous seismological observations, Science, 321, doi:10.1126/science.1160943.
Lecocq T., C. Caudron, and F. Brenguier (2014), MSNoise, a Python Package for Monitoring Seismic Velocity Changes Using Ambient Seismic Noise, Seismological Research Letters, 85(3), 715‑726, doi:10.1785/0220130073.
NCEDC (2014), Northern California Earthquake Data Center, UC Berkeley. Dataset, doi:10.7932/NCEDC.