FARB - Farallon Islands
We operate broadband and borehole stations under the network code BK. The Berkeley Digital Seismic Network (BDSN) is a regional network of very broadband and strong motion seismic stations designed to monitor regional seismic activity as well as provide high quality data. The Berkeley borehole stations have borehole geophones or other seismic sensors and may have other geophysical instrumentation.
BARD is our GPS network for monitoring crustal deformation across the Pacific-North America plate boundary and in the San Francisco Bay Area for earthquake hazard reduction studies and rapid earthquake emergency response assessment
| Station Name | FARB (FARI) |
| In Operation | 1994-01-26 16:00:00 -0800 - Present |
| Latitude | |
| Longitude: | |
| Elevation: | -20.8514 meters |
| Instrumentation | Broadband GPS |
Location
Site is located on the Farallon National Wildlife Refuge, offshore of San Francisco, and is under the auspices of the US Fish and Wildlife Service. This is a particularly tricky site for maintenance, since access to the Island is limited. This site experiences loss of power from time to time, due to problems with the island generator. Despite the 15 batteries, there are periods of time when the station is down due to loss of power. This site also experiences occasional problems due to corrosion of cables. The FARB site also is home to the continuously operating BARD station FARI.Network
Berkeley Digital Seismic Network (BK)Bay Area Regional Deformation Network Network (BARD)
Geology
Granite
Borehole Conditions
The sensors are installed in a near-surface vault and covered with rocks and foam in order to provide thermal stability.GPS Monument Description
Shallow-drilled braced monument in bedrock.
Table of Seismic Instrumentation
| Sensor | Datalogger | SEED Channels | Location | |
| Broadband | STS-5A | Q8 | BH?,HH?,LH? | 00 |
| Accelerometer | EPISENSOR ES-T | Q8 | HN?,LN? | 00,S0 |
GPS Instrumentation
| Receiver | Antenna | Radome | - | |
| GPS | SEPTENTRIO POLARX5 | SEPTENTRIO SEPCHOKE_B3E6 | SPKE | - |
Waveforms and associated metadata, and GPS data, are available at the Northern California Earthquake Data Center (NCEDC).
Waveform Data
- BK Information Directory, including
- List of station locations
- List of available channels
- Instrument Response
- Querying the archives
- Download waveform data
GPS Data
- Site log: fari.log
Data Type From To Low-rate raw -- -- Low-rate rinex 2/6/2024 present High-rate raw 2/6/2024 present High-rate rinex 2/6/2024 present
Noise Analysis
 |
GPS Data Quality
Completeness
Data completeness is defined both as "Completeness of observations" and "Cycle slips per observation". "Completeness of Obs." is the number of epochs in the final RINEX file normalized to the expected number. This percentage will go down if time is missing from the RINEX file. "Cycle slips per Obs." is the total number of detected cycle slip normalized to the total number of observations in the RINEX file. This number will increase as the receiver loses lock on satellites more frequently.
| Previous Year |
 |
| Lifetime |
 |
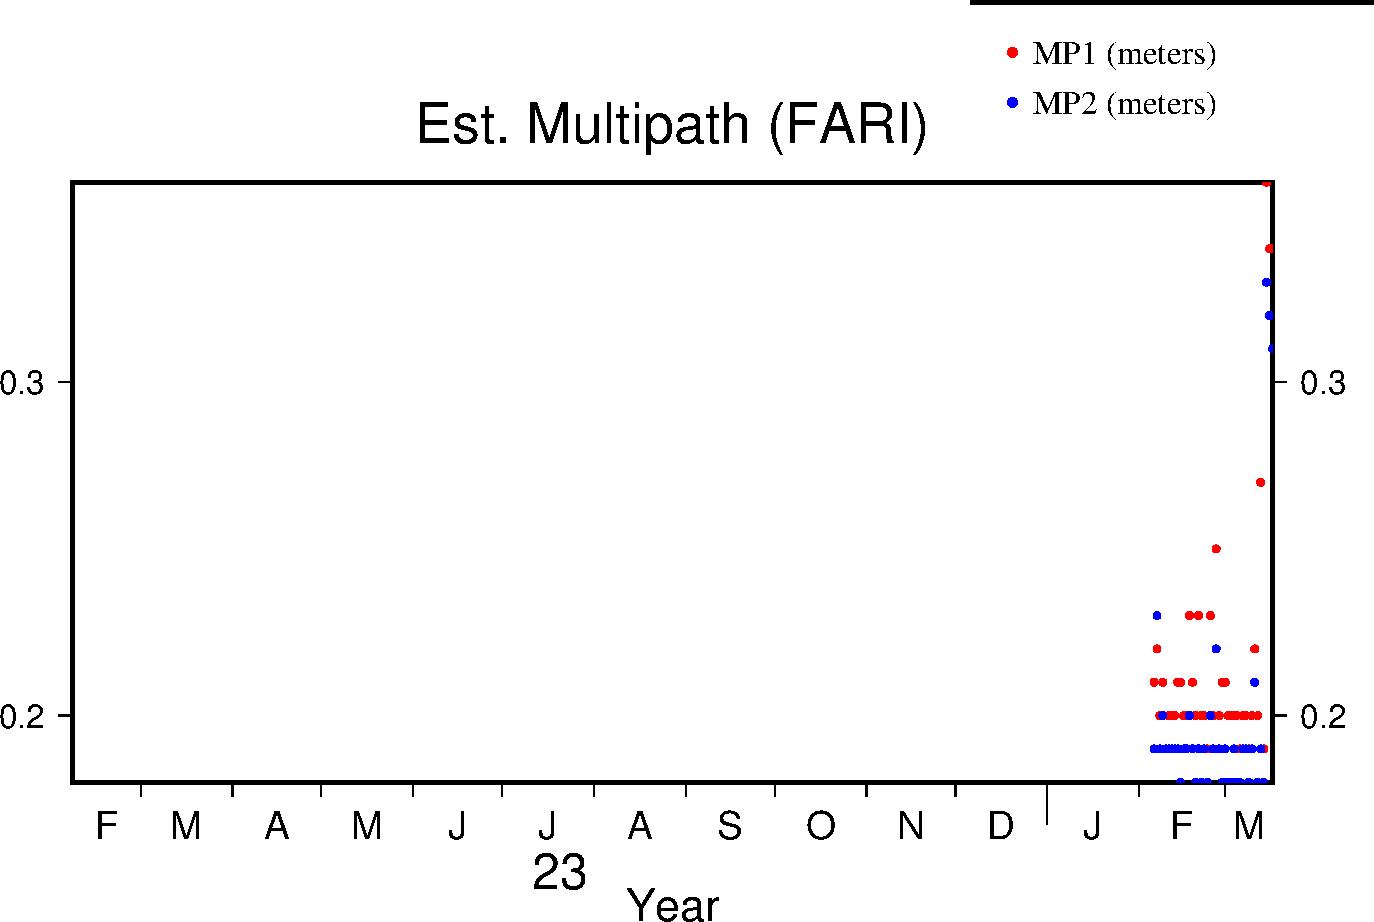
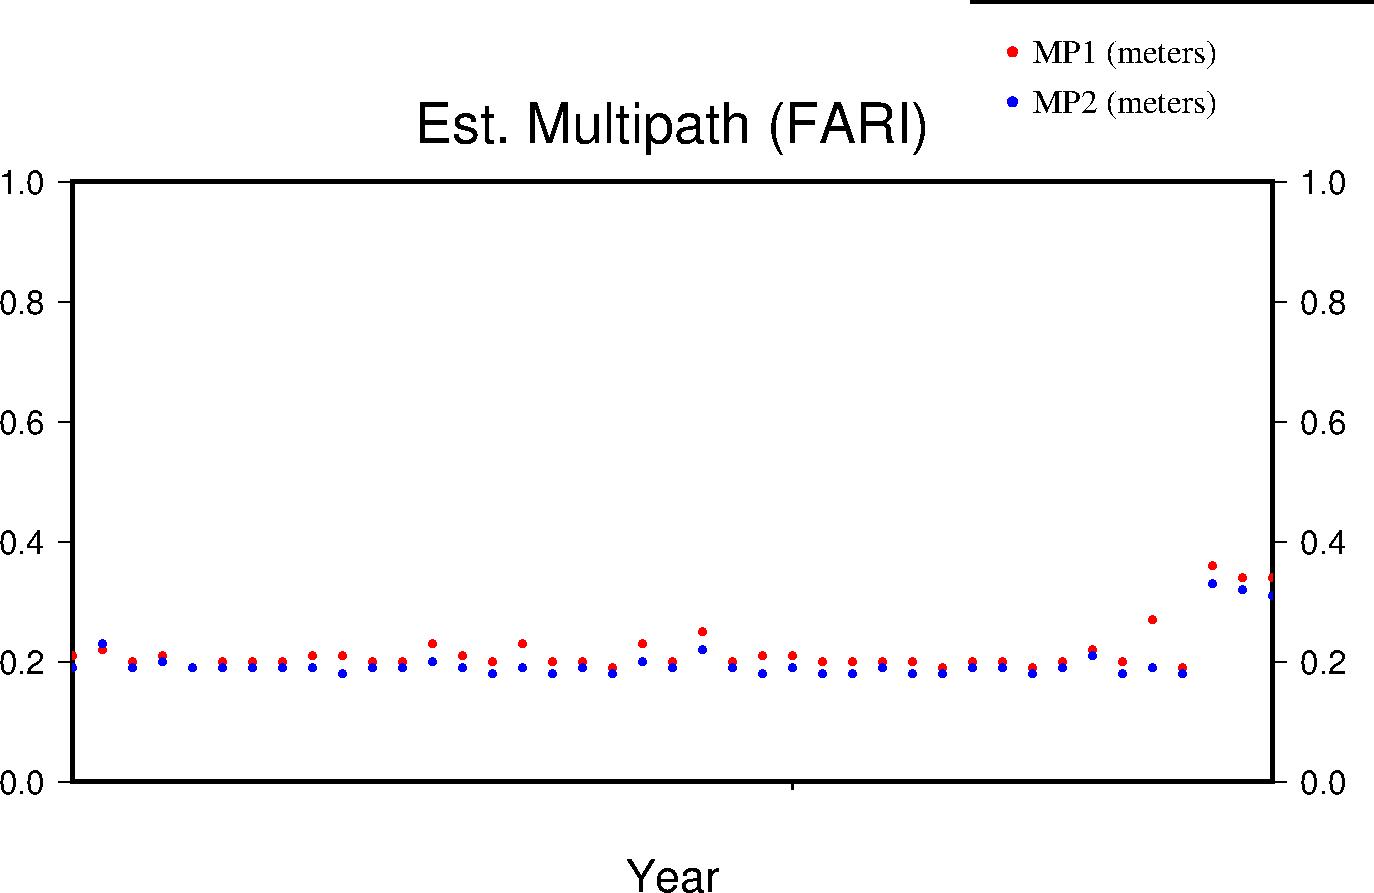
Multipath
The effects of multipath on the data are estimated by parameters for L1 and L2 (MP1 and MP2 respectively); see Estey and Meertens (GPS Solutions, 1999) for derivation. The daily value is the RMS of MP1 and MP2 throughout the day and for all satellites. Higher values indicate a greater prevalence and/or strength of multipathing, i.e. objects on the ground are providing multiple reflection pathways from the satellite to antenna.
| Previous Year |
 |
| Lifetime |
 |
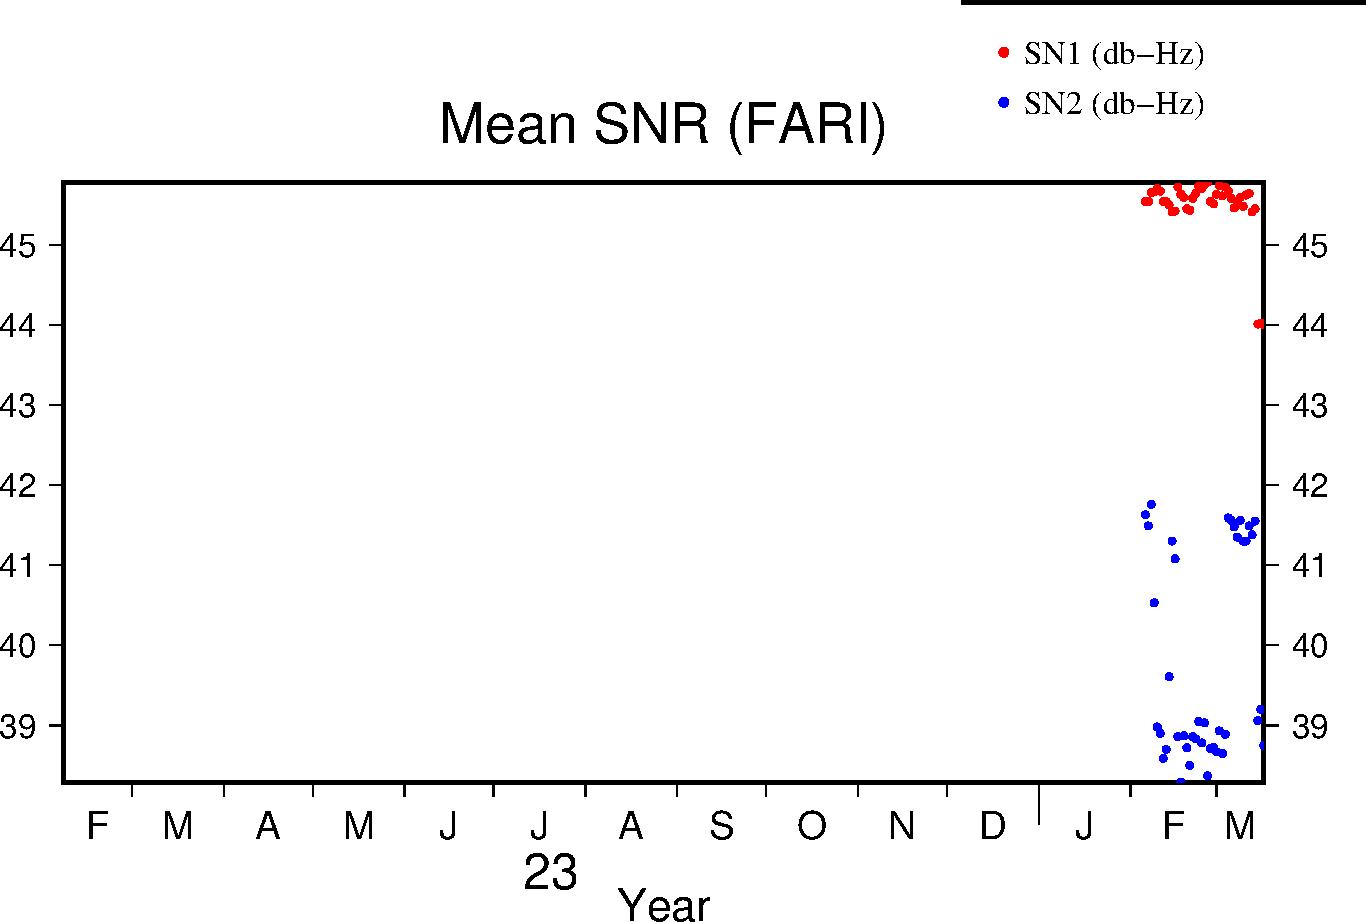
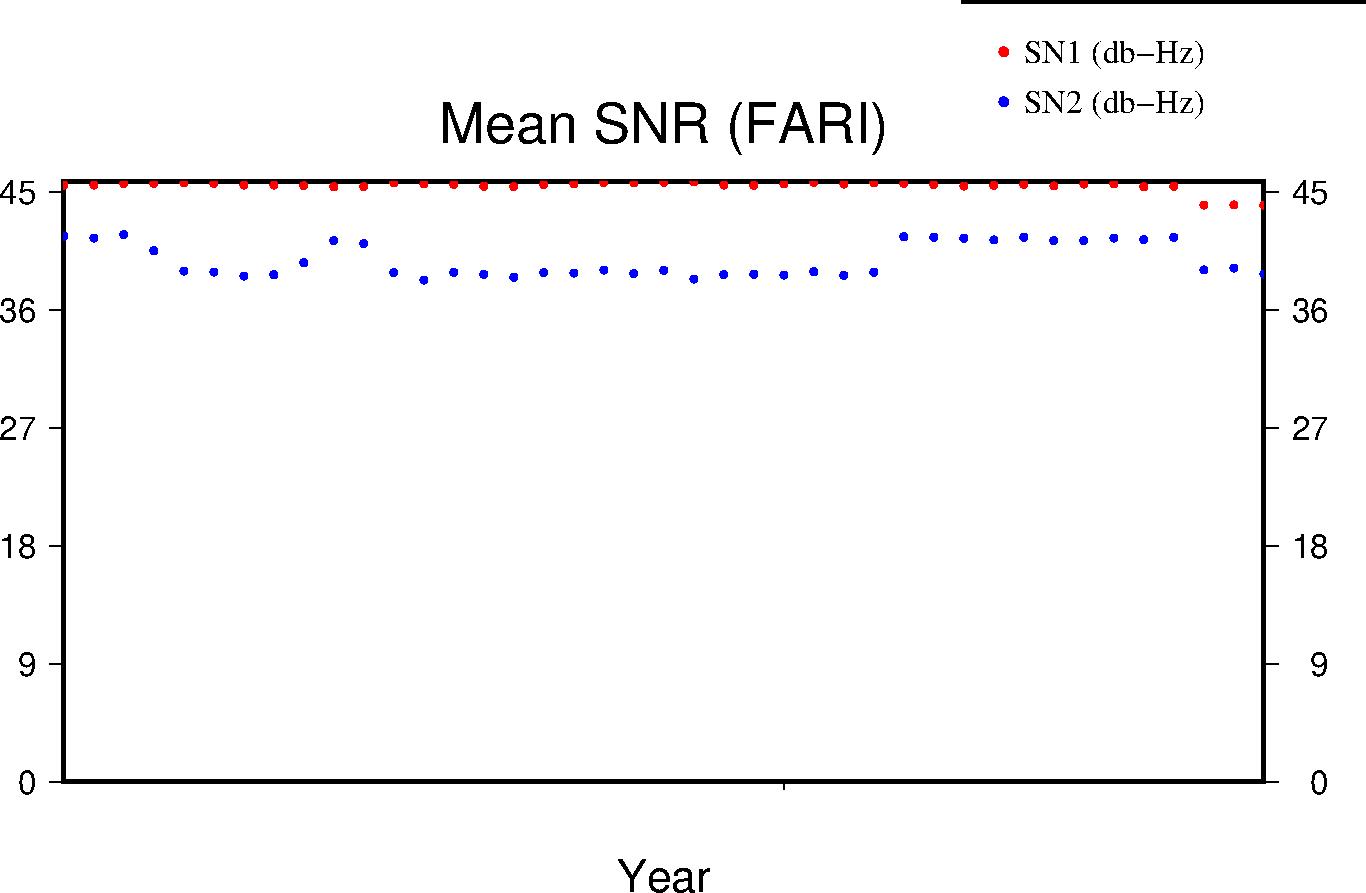
Signal-to-Noise Ratio
The Signal-to-Noise ratios are the mean values above the QC elevation mask for L1 and L2 respectively.
| Previous Year |
 |
| Lifetime |
 |