Monitoring of Relative Velocity Change at the Lassen Volcanic Center
We analyze ambient seismic noise wavefield to monitor temporal variations in seismic velocity at the Lassen Volcanic Center.
Temporal Evolution in Seismic Velocity
We estimate relative velocity changes (dv/v) by using MSNoise [Lecocq et al., 2014]. Following Brenguier et al. [2008] and Taira et al. [2015], our analysis focuses on waveforms in a frequency range of 0.1-0.9 Hz. A set of 4 seismic stations (stations LDH, LEL, LME, LRR) is used based on the high rate of data completeness. We determine the reference Green’s function (GF) for each station pair as the average of 1-day GFs obtained in the time interval, January 2012 through April 2016. The time history of dv/v is determined by measuring delay times between 5-day stacks of GFs and the reference GF.
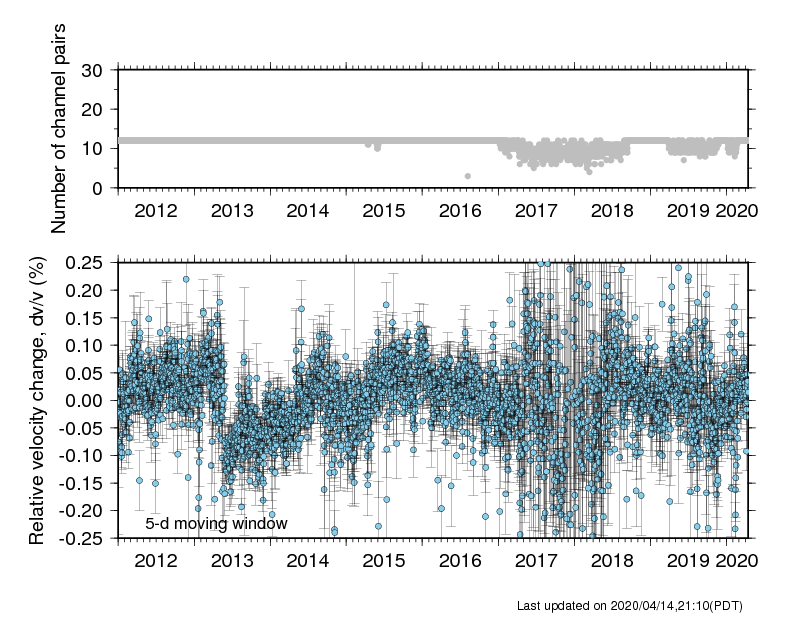
We include horizontal component data for the dv/v measurement. The maximum available number of channel pairs (e.g., ZZ, ZN, ZE) is 12. To monitor the relative velocity change, we implement an automated system that updates the time history of dv/v shown in Figure 1. This automated process makes use of waveforms archived at the Northern California Earthquake Data Center [NCEDC, 2014]. Figure 1 is currently updated every day. Our monitoring system finds a 0.1% velocity reduction in late May 2013, which is most likley due to dynamic stress changes from the magnitude 5.7 Greenville earthquake.
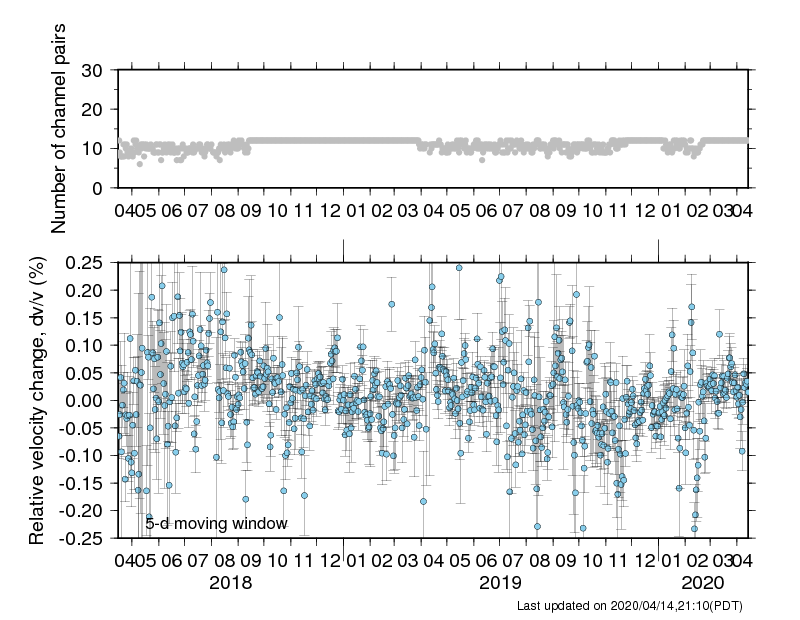
Figure 1. Result of the relative velocity change (dv/v) for the last 2 years. Top panel shows the number of channel pairs used to infer dv/v. The bottom panel shows the time history of dv/v. The error bars represent the two-sigma standard deviation. Result for the dv/v time series from January 2012 to current is here.
Map View
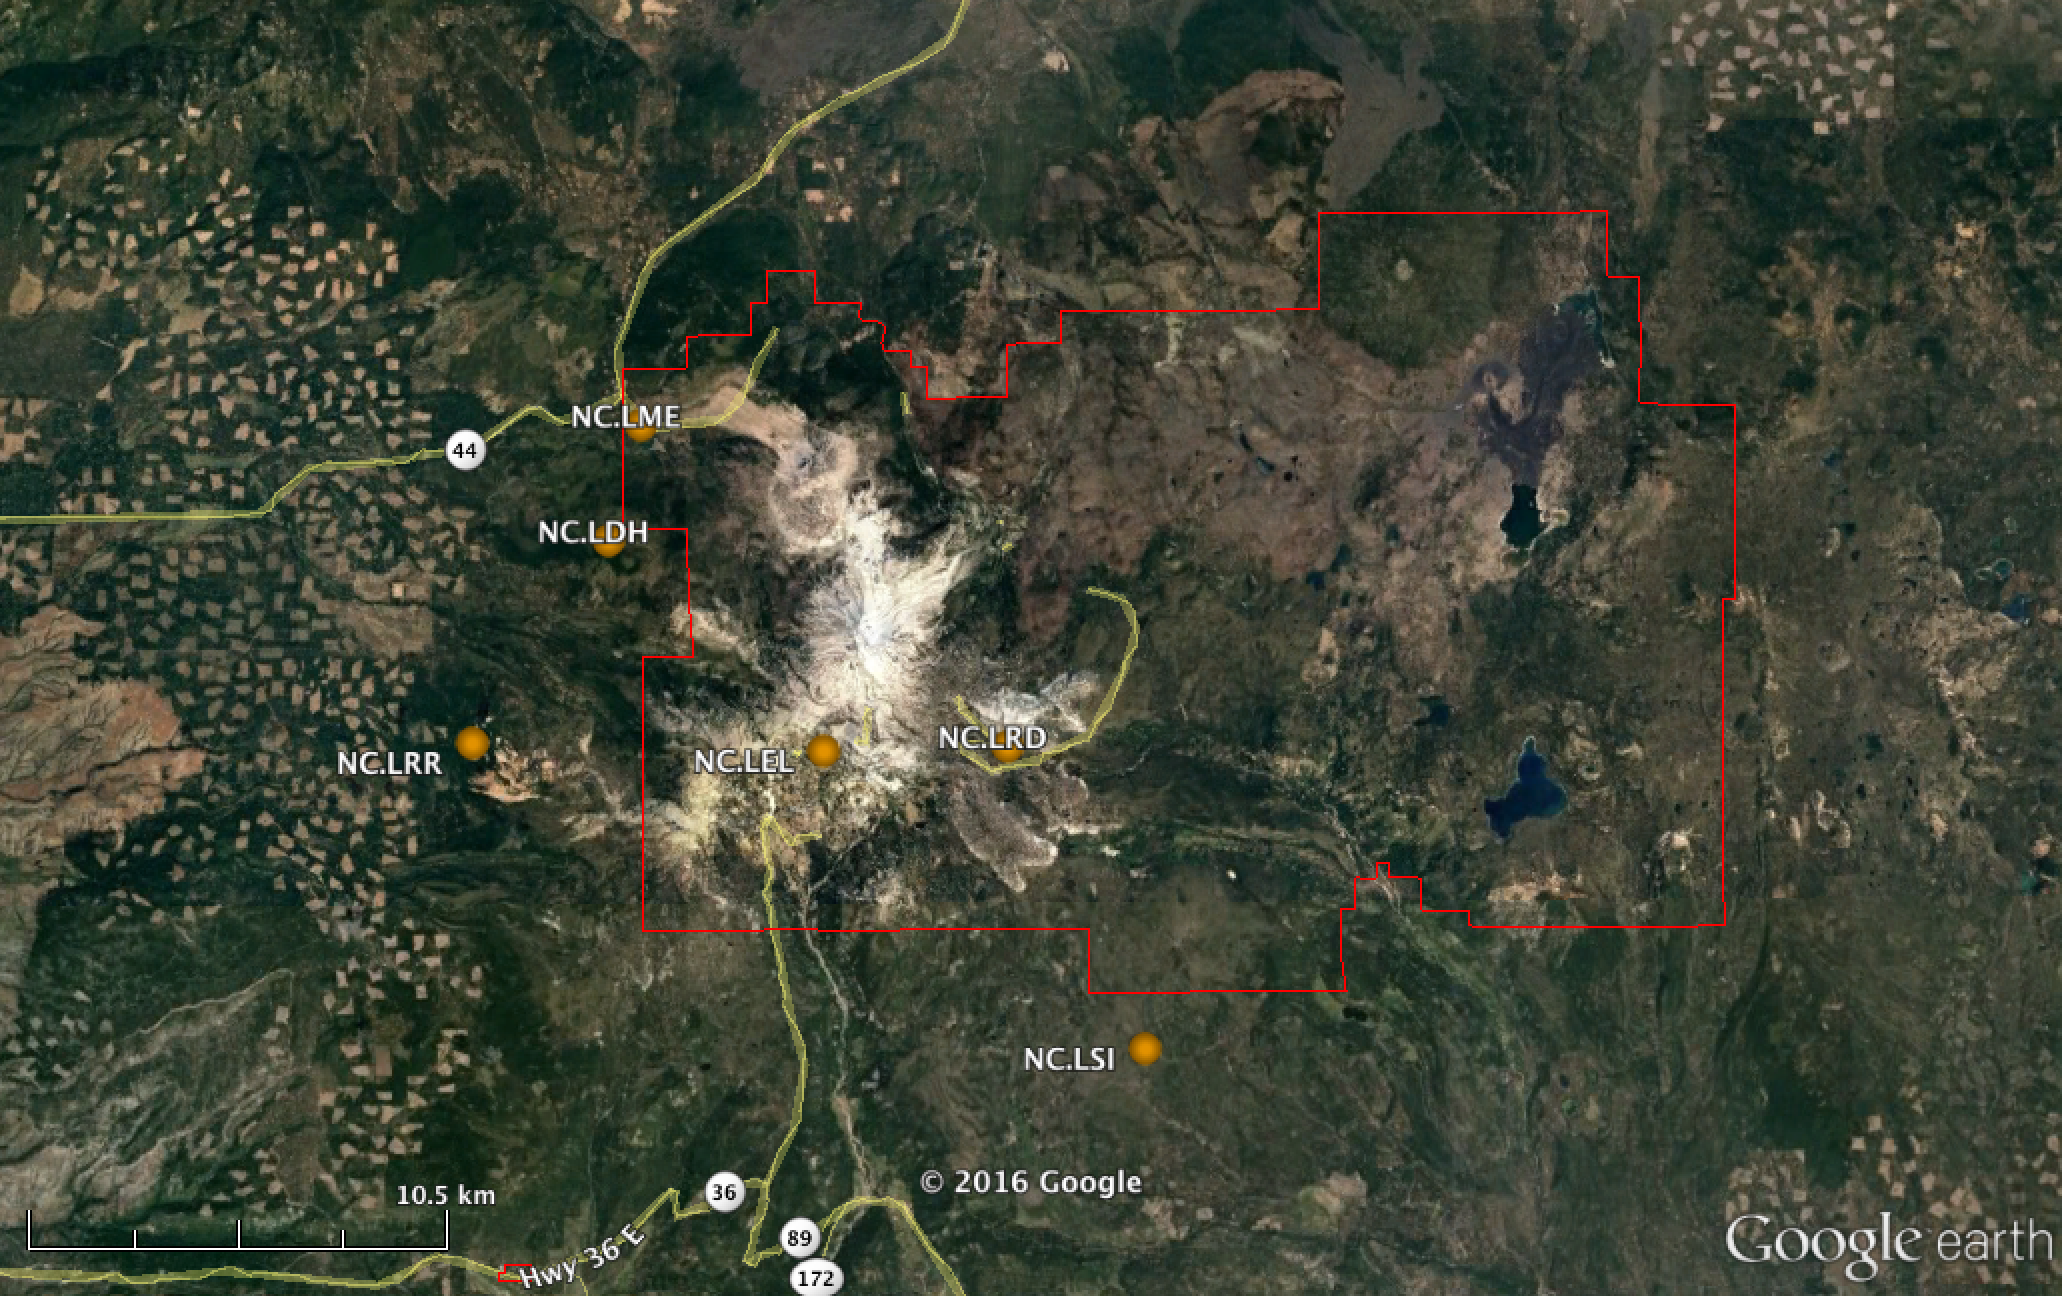
Figure 2. Map view of seismic stations from the Northern California Seismic Network operated by U.S. Geological Survey. Red line indicates the boundary of the Lassen Volcanic National Park.
Acknowledgments
This work is partially support by the France-Berkeley Fund 2014-0051 and the National Science Foundation EAR-1053211. Waveform data, metadata, and earthquake catalog for this study were accessed through the Northern California Earthquake Data Center (NCEDC) [NCEDC, 2014].
References
Brenguier, F., M. Campillo, C. Hadziioannou, N. M. Shapiro, R. M. Nadeau, and E. Larose (2008), Postseismic relaxation along the San Andreas Fault at Parkfield from continuous seismological observations, Science, 321, doi:10.1126/science.1160943.
Lecocq T., C. Caudron, and F. Brenguier (2014), MSNoise, a Python Package for Monitoring Seismic Velocity Changes Using Ambient Seismic Noise, Seismological Research Letters, 85(3), 715‑726, doi:10.1785/0220130073.
NCEDC (2014), Northern California Earthquake Data Center, UC Berkeley Seismological Laboratory Dataset, doi:10.7932/NCEDC.
Taira, T., F. Brenguier, and Q. Kong (2015), Ambient noise based monitoring of seismic velocity changes associated with the 2014 Mw 6.0 South Napa earthquake, Geophys. Res. Lett., 42, 6997–7004, doi:10.1002/2015GL065308.